Gain real-time visibility into your infrastructure’s health and performance. At PG Services, we provide Elastic-powered infrastructure metrics monitoring that allows you to track, analyze, and act on data from servers, containers, Kubernetes clusters, databases, cloud platforms, and more.
Why Infrastructure and Integration Monitoring Matters
In today’s distributed systems, observability of only the source or destination isn’t enough. Visibility into the integration layer is crucial for:
Proactive Issue Resolution
Detect anomalies and performance degradations early—before they impact end users.
Optimization
Uncover inefficiencies and bottlenecks to fine-tune throughput and latency across interconnected services.
Reliability
Track SLAs and ensure consistent data flow through critical components.
Downtime Reduction
Quickly identify and isolate root causes to minimize mean time to resolution (MTTR).
Scalability
Monitor how systems respond to load, enabling informed decisions about resource scaling and cost management.
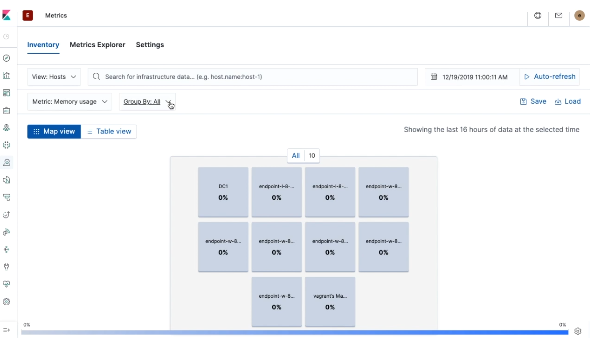
Real-Time Monitoring with the Metrics App
The Elastic Metrics app gives you a centralized view of your infrastructure—monitor everything from CPU and memory to network I/O and disk activity in near real-time. With support for high-cardinality tags, flexible fields, and rich dimensions, you can explore metrics across your entire environment at Elasticsearch speed and scale.
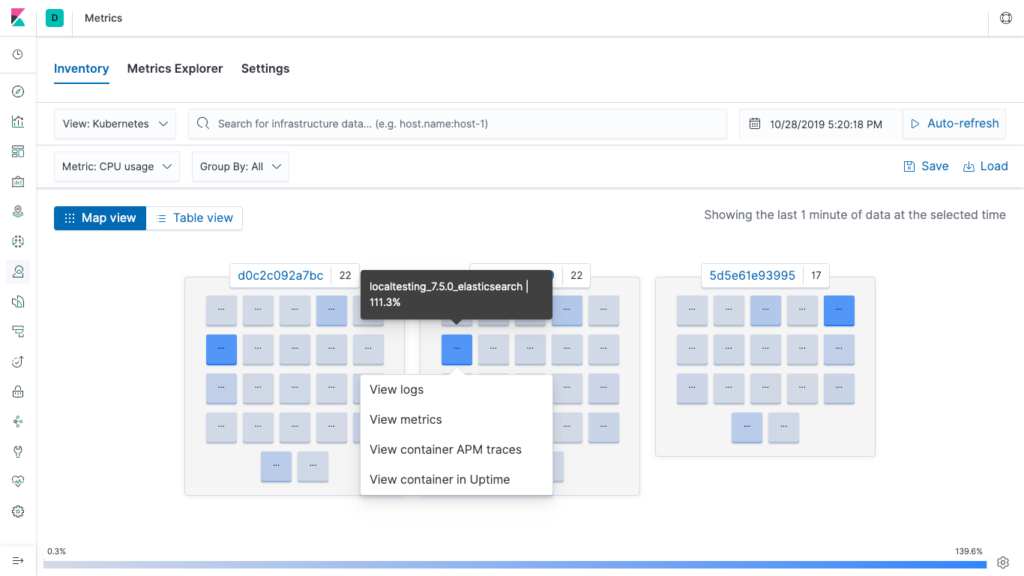
Drill down from metrics into logs, traces, or uptime data—seamlessly connecting observability data to uncover and resolve issues faster.
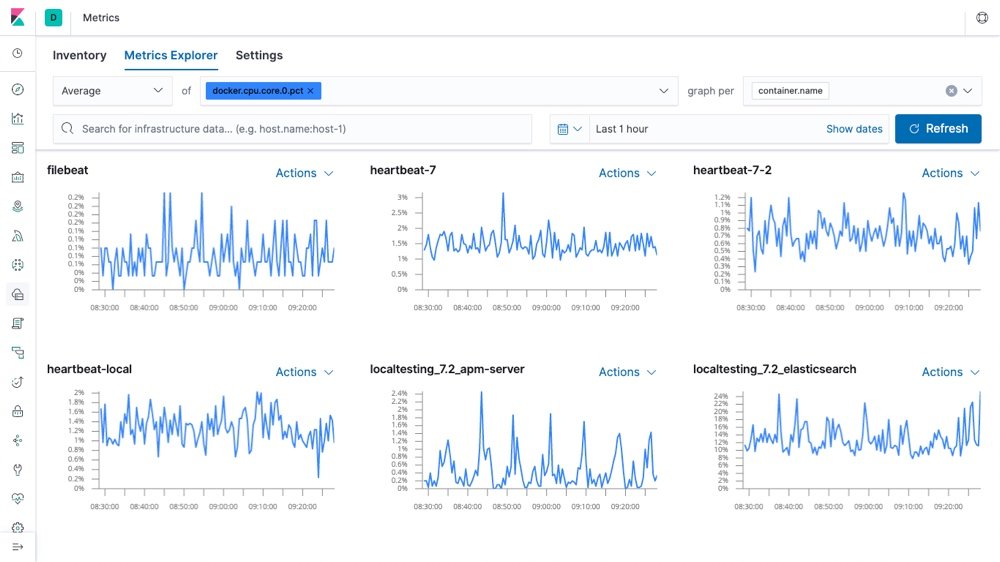
Explore Data at Any Scale
Analyze metrics from petabyte-scale datasets with the speed of Elasticsearch’s columnar store and indexing power. Use Time Series Visual Builder to visualize and interact with data, or apply built-in Machine Learning to detect anomalies across distributed sources—automatically and at scale.
Filter & Alert with Precision
Filter metrics dashboards by category—CPU, memory, disk, network, and more. Set intelligent alerts with webhook support to trigger actions or integrate directly with third-party systems like Slack, Jira, or ServiceNow.
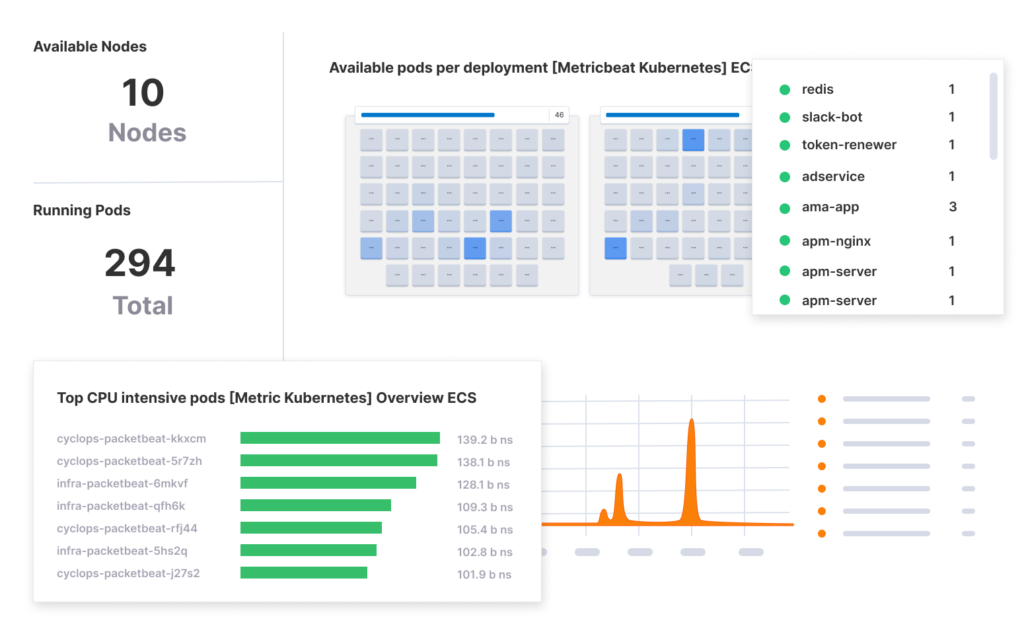
Plug-and-Play Monitoring Modules
Choose from over 40 pre-built modules to extend observability across databases, cloud providers, application servers, message queues, and more. PG Services enables you to enrich your monitoring environment with insights across the full stack—no custom development needed.
Key Components of Effective Observability
Logging
Capture and structure log events from across your stack.
Monitoring
Track real-time metrics, including throughput, latency, and error rates.
Tracing
Map transactions across microservices to understand request flows and latency sources.
Alerting
Automate notifications to keep stakeholders informed and responsive.
Anomaly Detection
Use ML to identify deviations from normal behavior—before they become incidents.
Our Approach at PG Services
At PG Services, our Elastic-certified engineers build intelligent, scalable observability solutions customized for your infrastructure and integration needs. We begin by aligning with your operational goals and defining key success metrics.
Our team implements standardized monitoring systems that offer a unified view of your infrastructure’s performance while ensuring security and scalability. We continuously evaluate and optimize your observability setup to keep pace with evolving business and technology landscapes.
Ready to turn infrastructure metrics into actionable intelligence?
Talk to PG Services today for a tailored observability solution that ensures performance, reliability, and visibility—end to end.